Universe is divided into nine "Stages", each of which offers a different window into the data. Transitions between the stages are fast and fluid, and controlled through a menu of clickable constellations running along the bottom edge of the screen.
The basics
Defining the universe
Universe is a system that can display the
zeitgeist of information for arbitrarily defined data sets. This means that the experience of using Universe is different for each person, based on his or her interests. Universe offers several ways to specify the nature of the data set to be examined. The most flexible way is the search box in the top left corner of the screen, immediately to the right of the word "UNIVERSE". This is a smart search box which can accept queries like:
- climate change (finds the zeitgeist of "climate change")
- Google (finds the zeitgeist of "Google")
- Bono (finds the zeitgeist of "Bono")
- Iraq (finds the zeitgeist of "Iraq")
- Iraq August 27, 2006 (finds the zeitgeist of "Iraq" from August 27, 2006)
- Iraq 2006 (finds the zeitgeist of "Iraq" from 2006)
- August 2006 (finds the zeitgeist of August 2006)
In this way, Universe can be asked to reveal the zeitgeist of any date / concept / person / company / etc. Once a universe of data has been specified, the system then presents that universe in nine different "Stages", which are outlined below.
Changing dates
In addition to specifying dates in the search box, as explained above, the viewer can also use the four basic date buttons, expressed as constellations in the top right corner of the screen. These buttons allow the viewer to toggle quickly between different date ranges, while keeping the same data constraints on the universe. For example, if the universe of "Iraq" is selected, these buttons can be used to toggle between the zeitgeist of "Iraq" from the past day, the past week, the past month, and the past year.
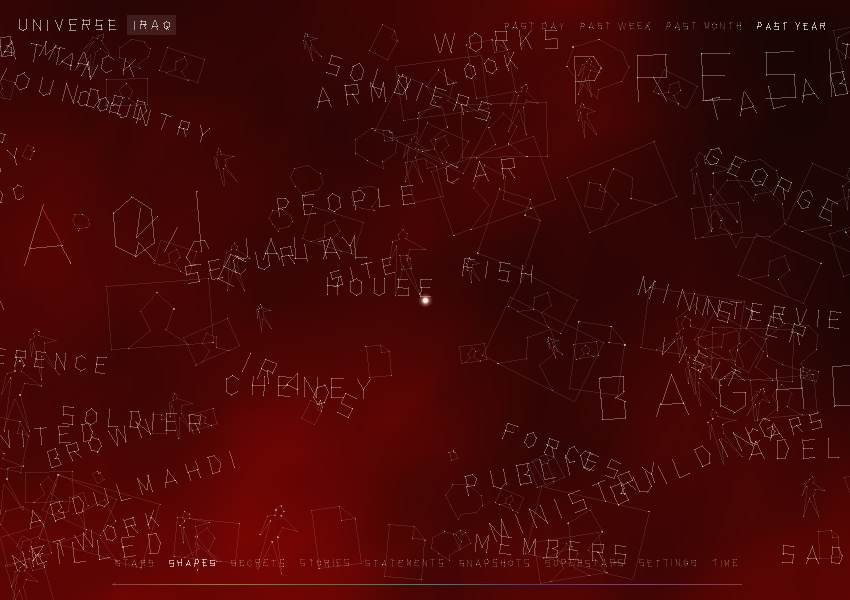
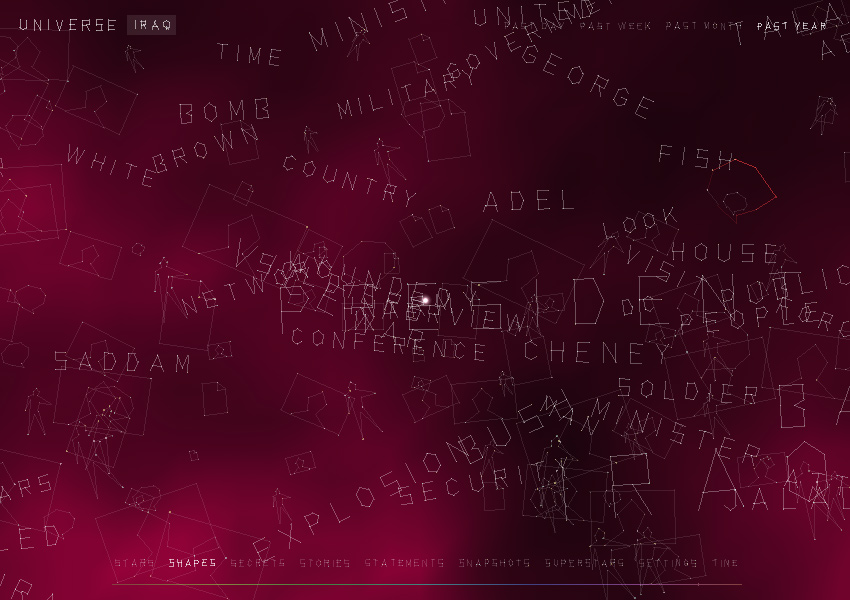
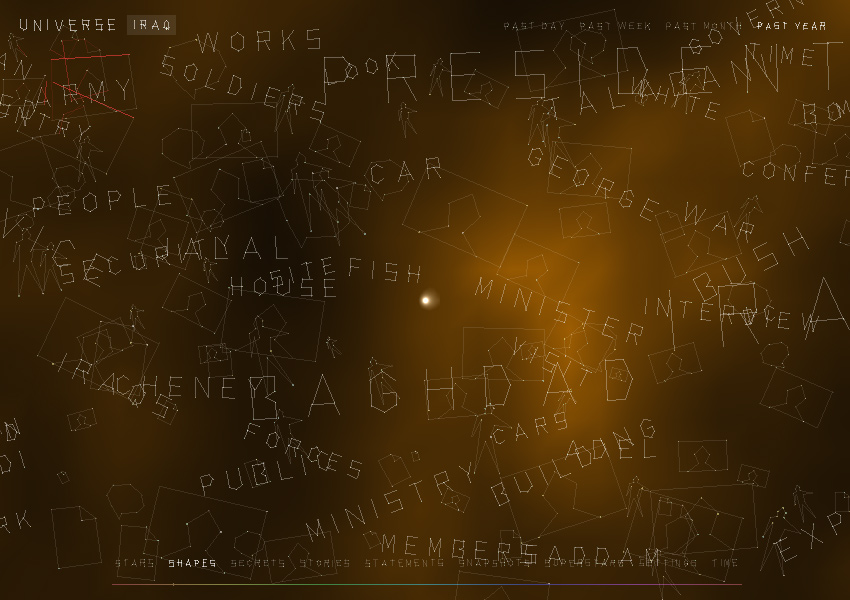
Defining the color
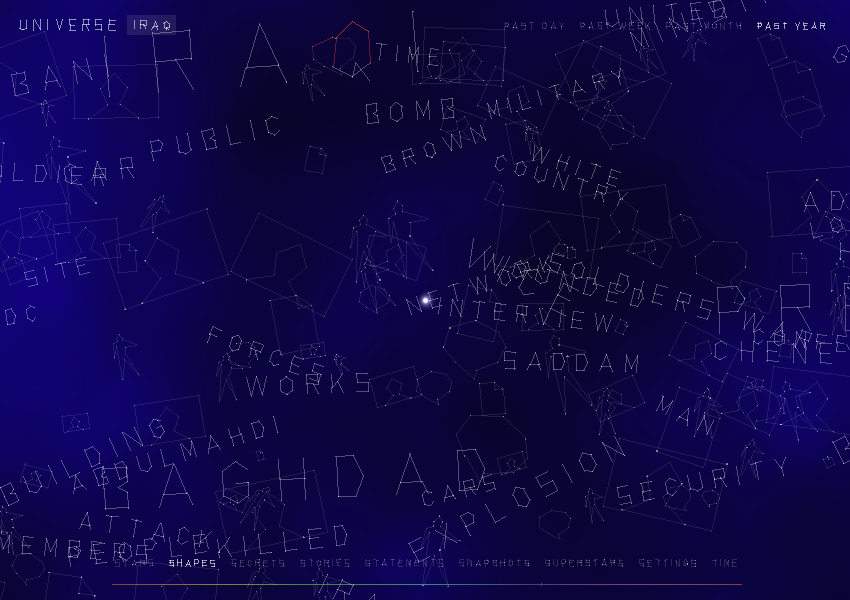
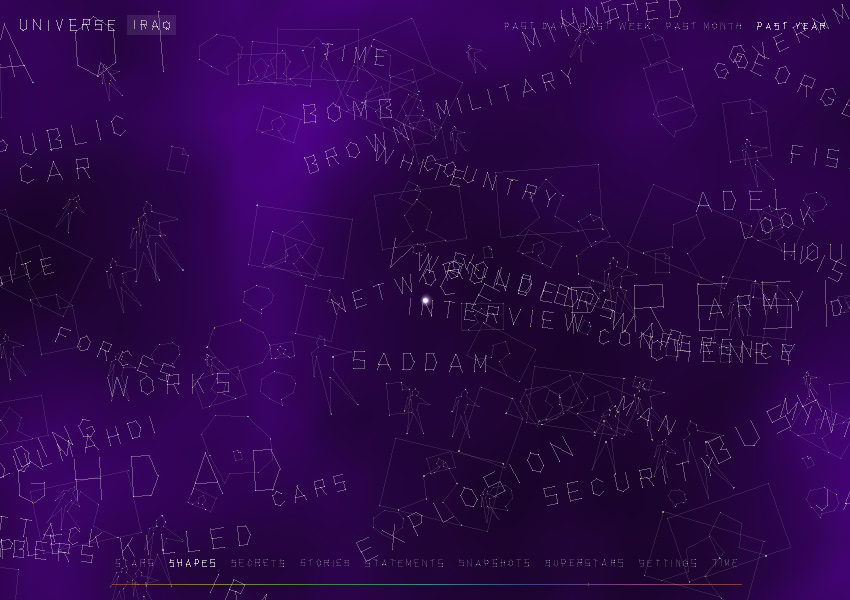
The background of Universe is a shifting aurora borealis, implemented using a Perlin noise algorithm. The color of Universe can be controlled by the viewer, using a single-pixel color slider running along the bottom edge of the screen. The mouse need only touch the color slider, and color of the aurora borealis will immediately shift to the requested hue. What follows are various color palettes within Universe.
Typography
Universe uses a custom typography system, developed for the project, in which characters are formed dynamically from connected dots, to resemble constellations. In this system, the characters are not static, but instead flicker and quiver as stars would, assuming an organic quality. For pieces of static content (headlines, excerpts, captions, dates, etc.), the
DINMittelschrift typeface is used.
The nine stages
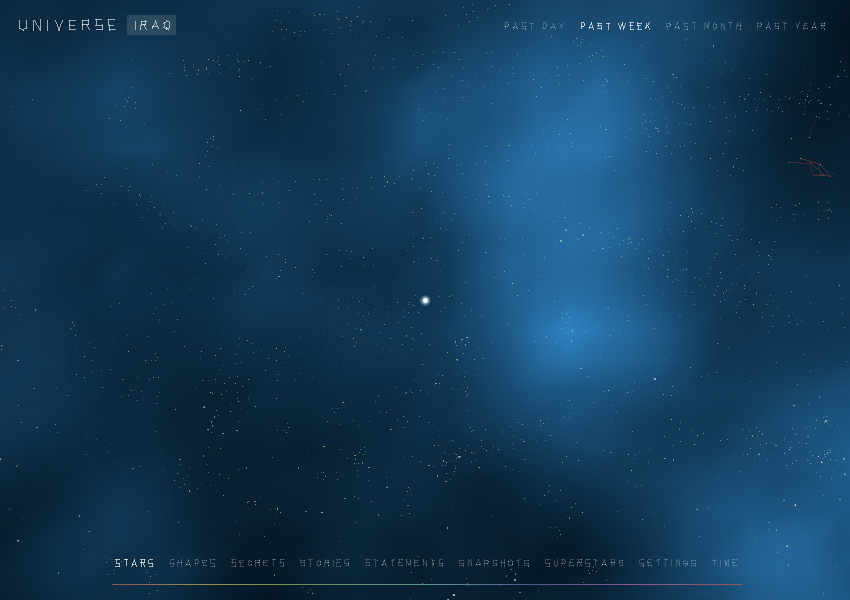
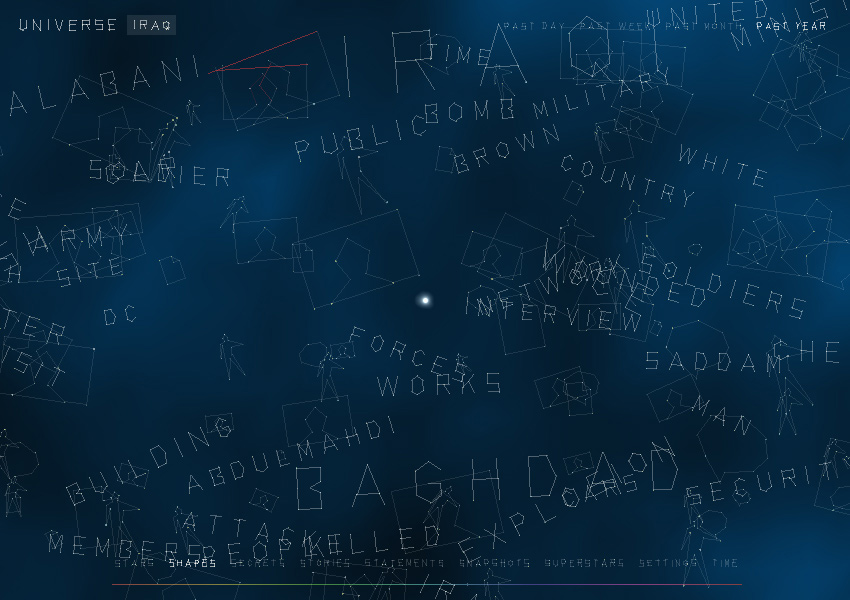
1) Stars
In Stars, the first stage, Universe is at its most abstract. The viewer sees thousands of stars, each different sizes, colors, and opacities, twinkling and sliding slowly through the sky. Each of these stars corresponds to a specific event, artifact, or persona from the real world — a story, a quote, an image, a person, a company, a team, an organization, etc. No information is revealed by these stars until the mouse is moved across the star field, which prompts the stars to connect to each other, causing constellations to emerge. In this way, the viewer can explore the star field, revealing constellations, like an archaeologist sifting through sand. The Stars stage expresses the primary conviction behind information design — that the patterns are hiding there, in plain sight, if only we could organize the data in the right ways, to make those patterns apparent. The eight remaining Stages of Universe attempt to reveal those hidden patterns.
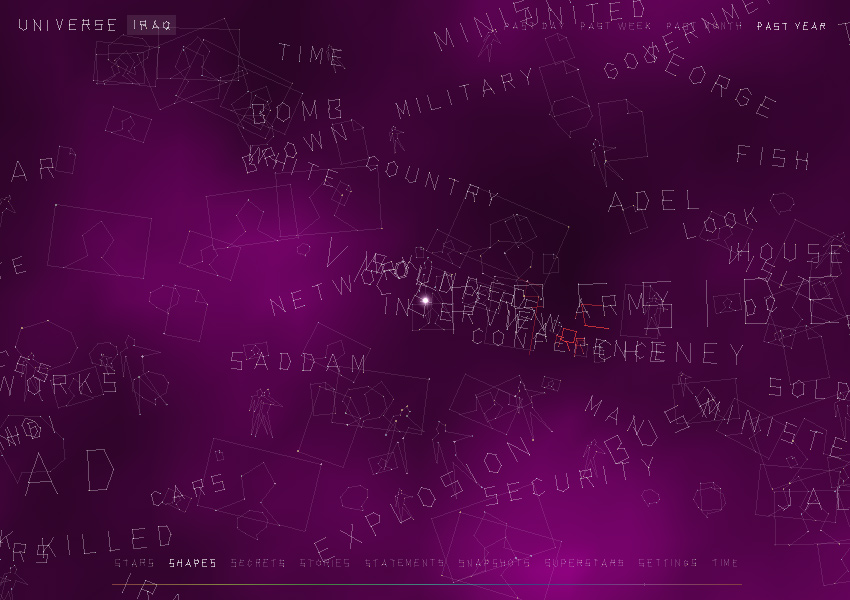
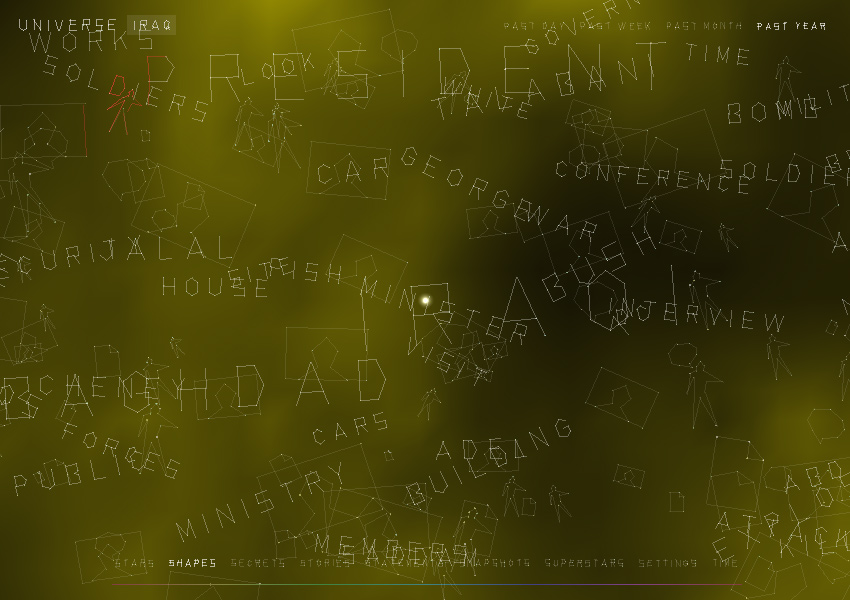
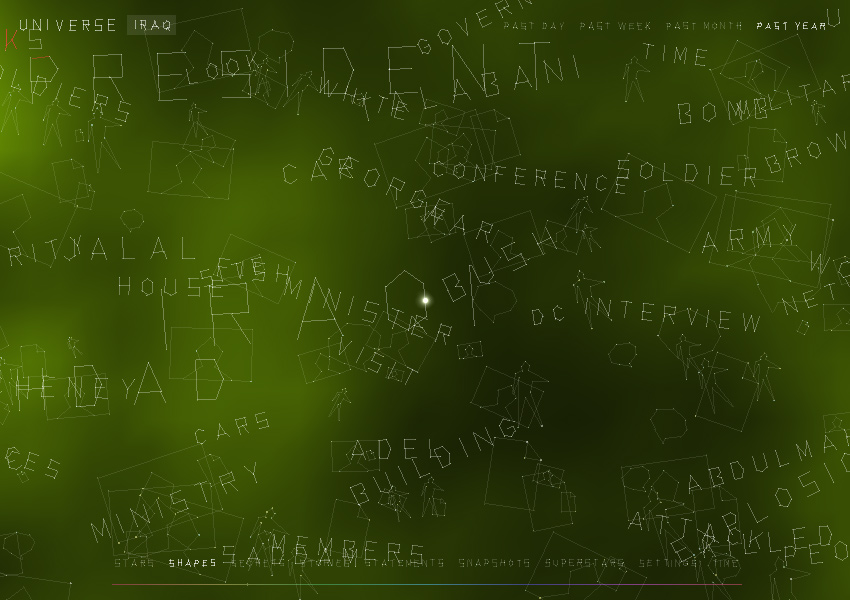
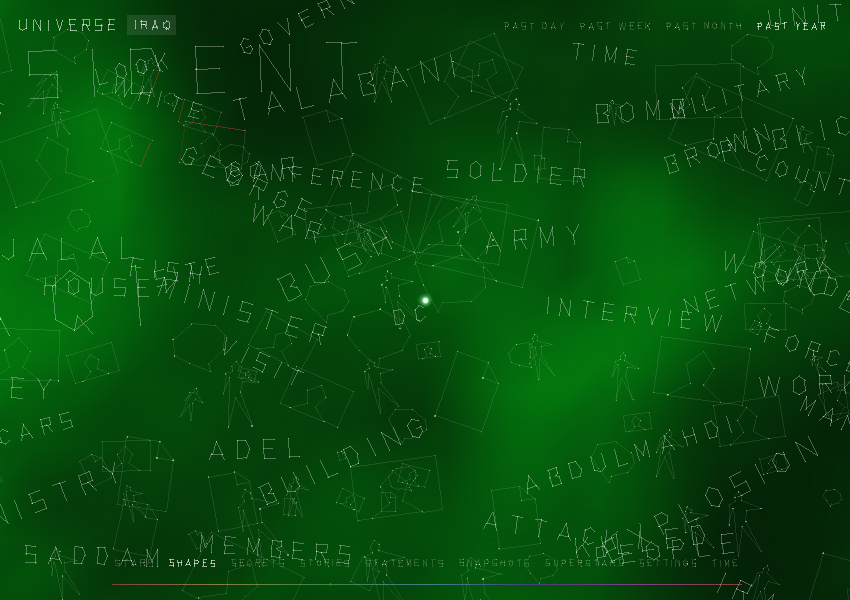
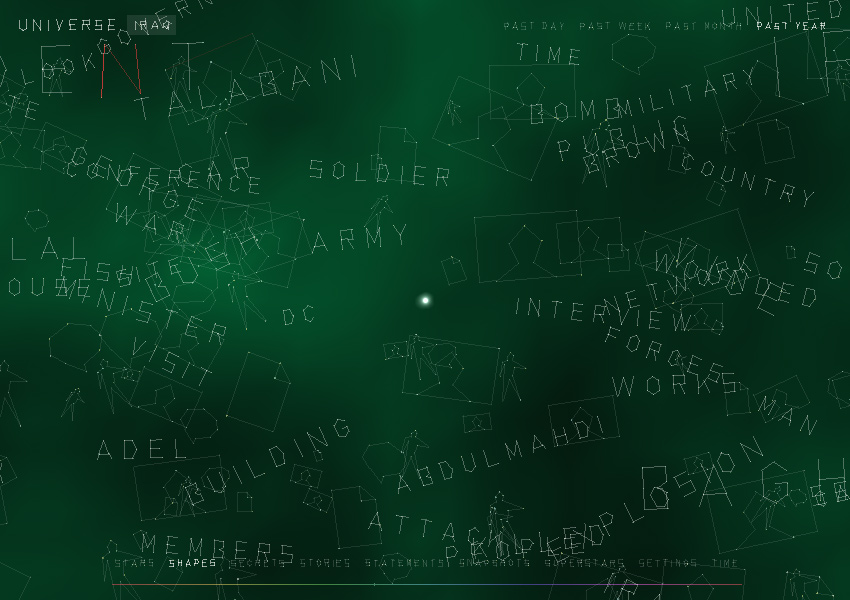
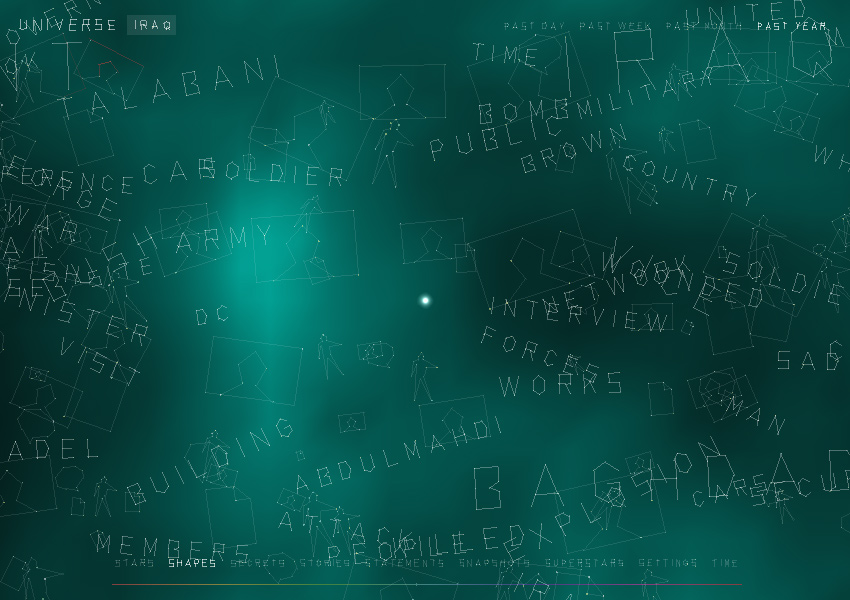
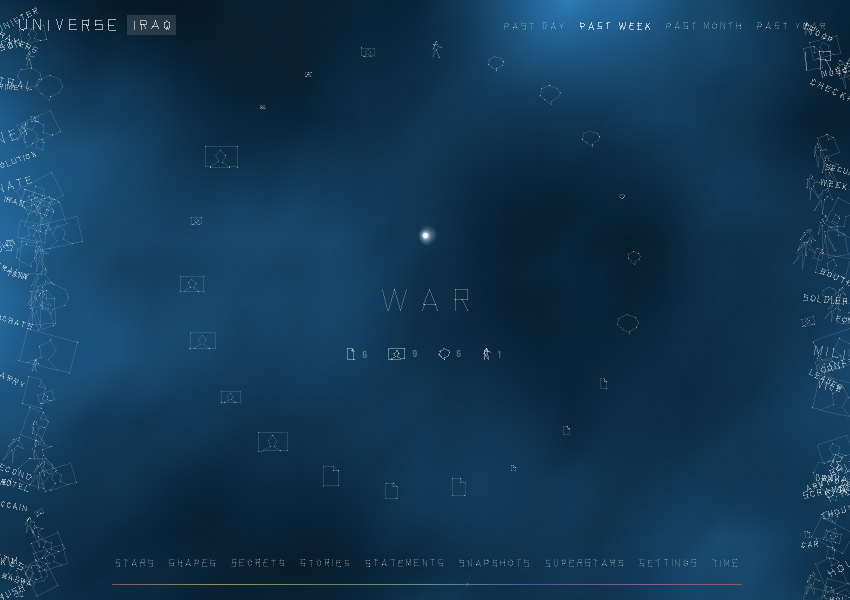
2) Shapes
In Shapes, the second stage, all of the constellations are revealed at once, and move slowly across the sky. This stage represents Universe at its most mythical, as we could almost imagine looking up into our own night sky and seeing these shapes painted there. The constellations depict words (illustrated with large quivering letters), people (illustrated with icons of a walking human), quotes (illustrated with a stylized quote bubble), and images (illustrated with an icon of a photograph). The constellations are scaled based on their importance to the currently selected universe — the big ones are important, the smaller ones less important. The Shapes stage presents the constellations of the universe in question, providing a visual zeitgeist.
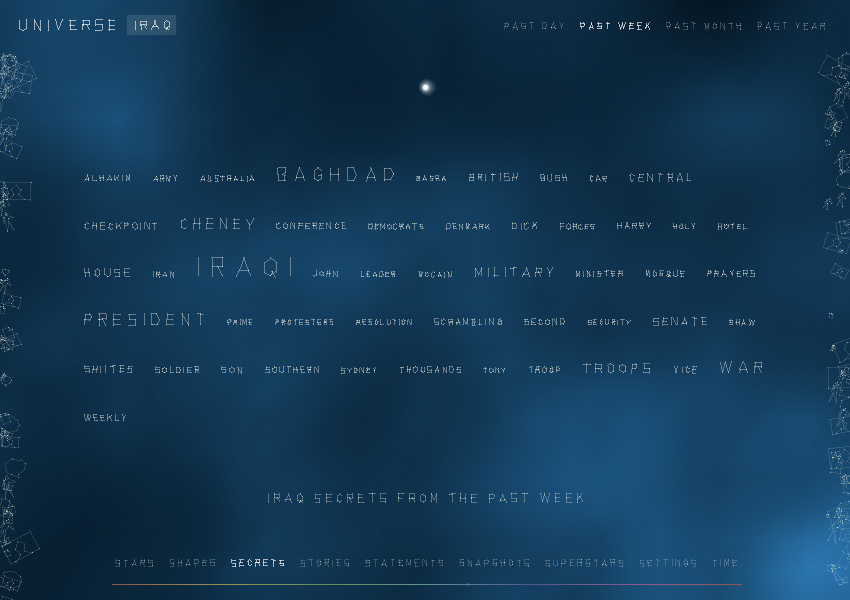
3) Secrets
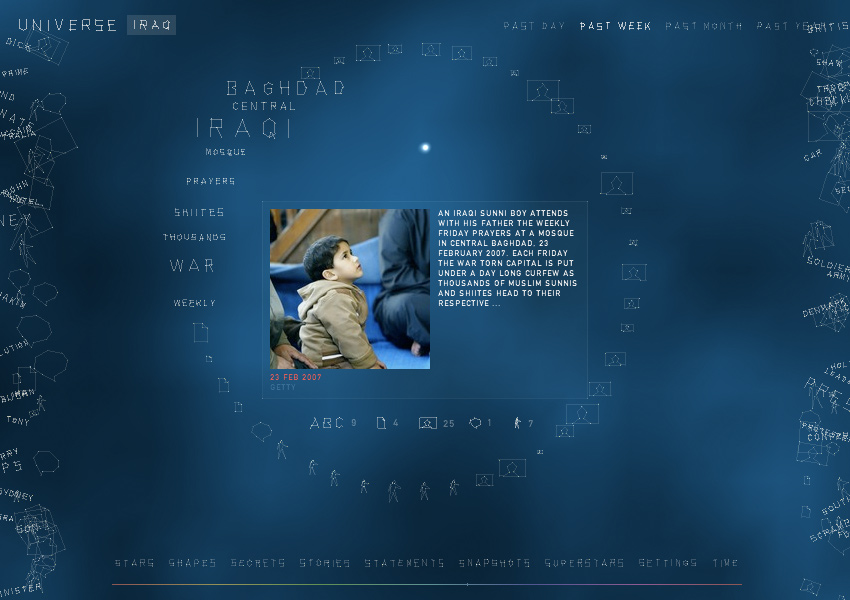
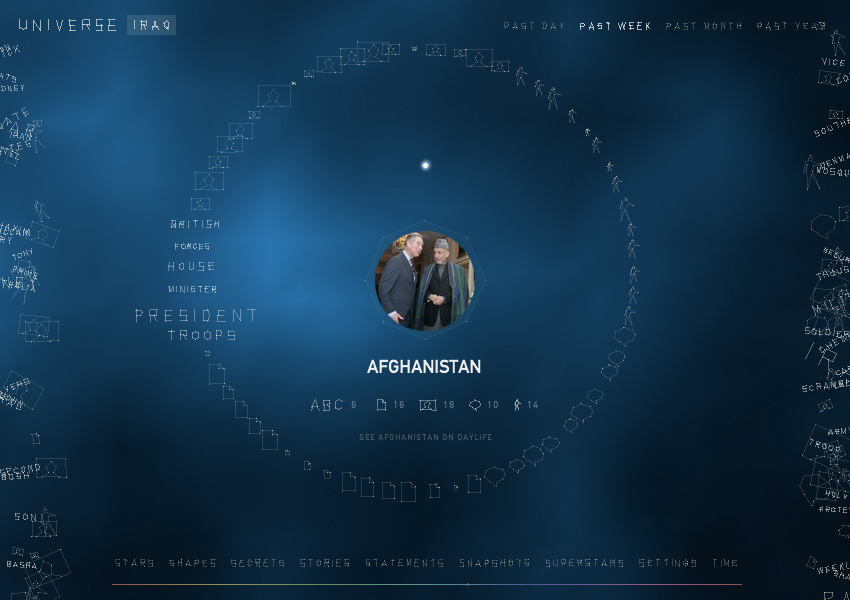
In Secrets, the third stage, Universe extracts the most salient single words from the currently selected data set, and presents them in parallel rows, sorted alphabetically, with each word scaled to reflect its relative importance to the universe at hand. Any word can be clicked, making it the center of the universe, and causing all related constellations to enter into its circular orbit. If a selected secret is clicked a second time, the system will find the entire universe of that superstar. Secrets presents a simple way to see the grand themes that define a data set.
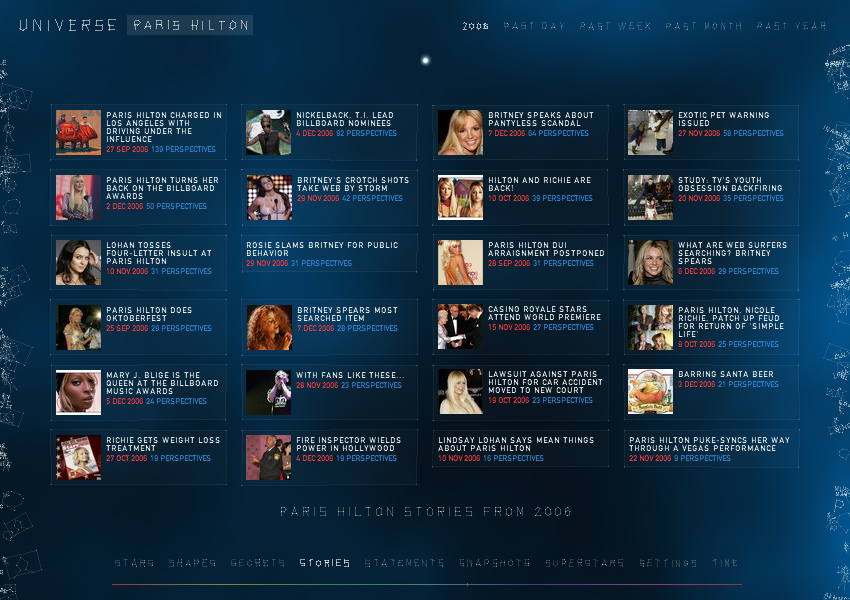
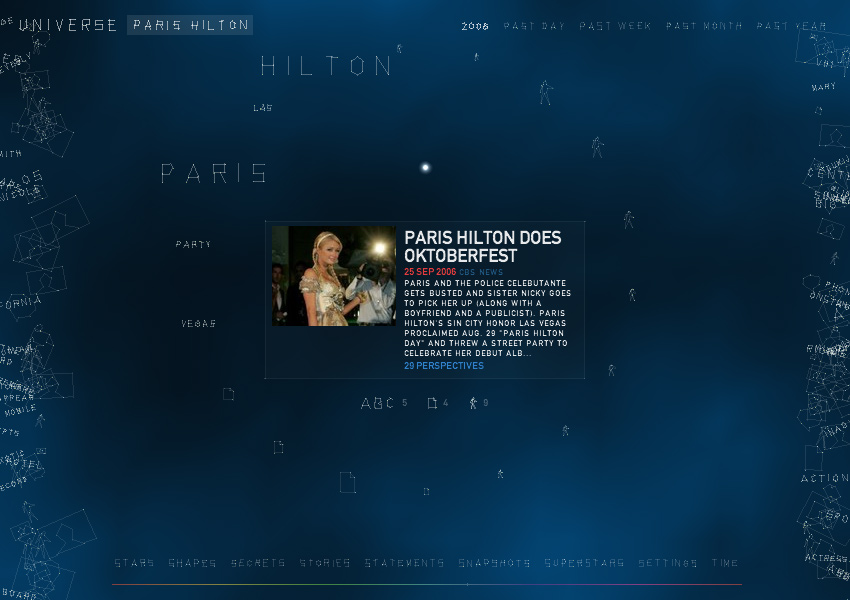
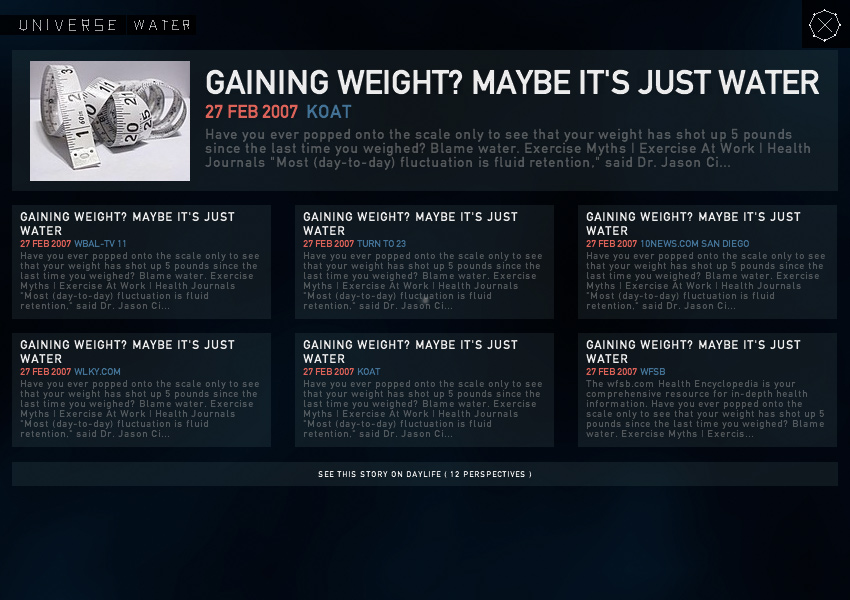
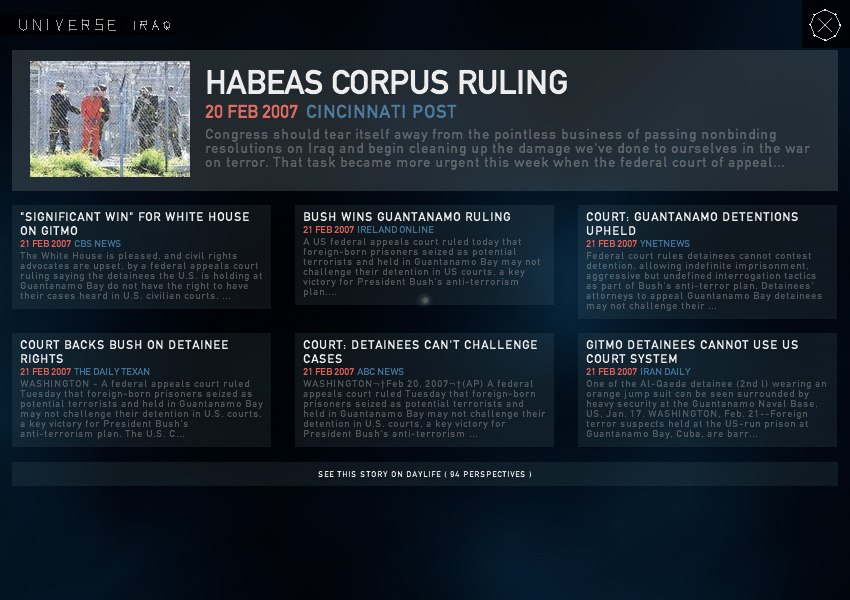
4) Stories
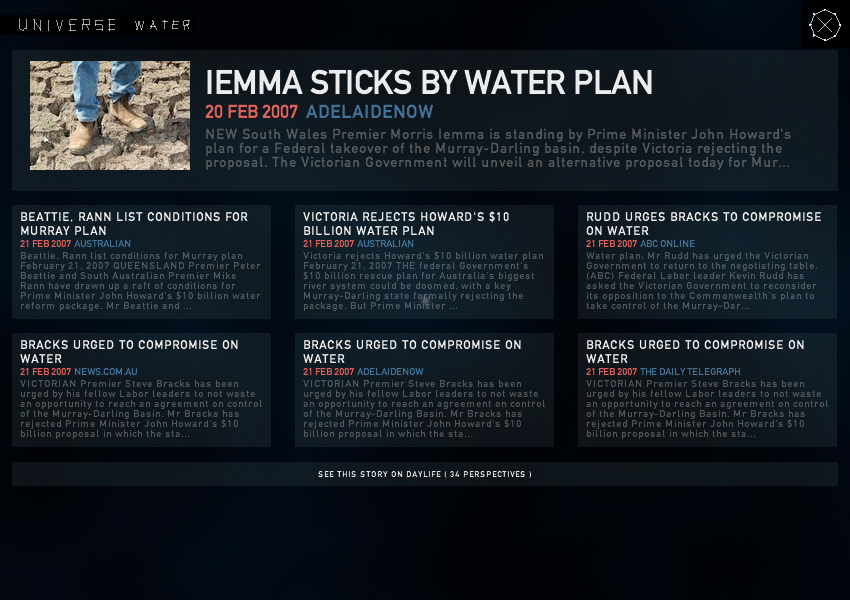
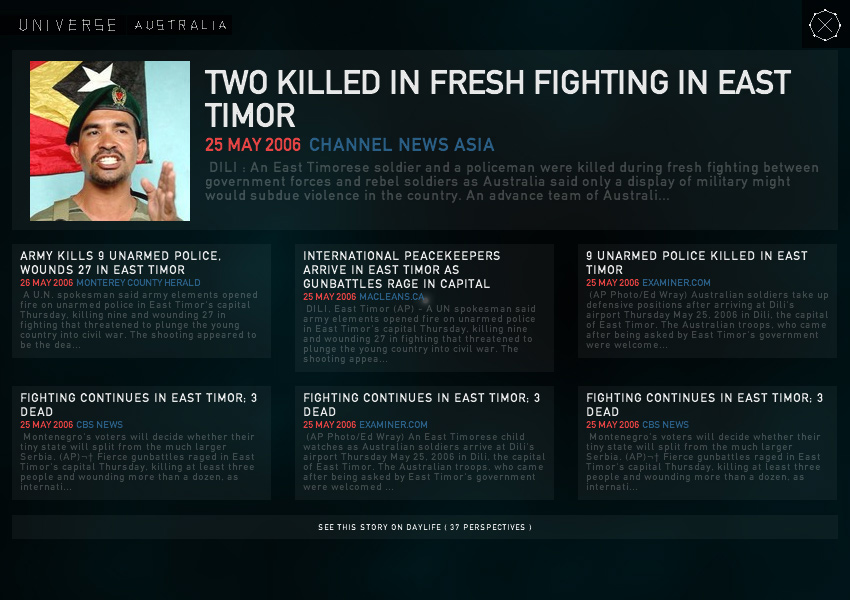
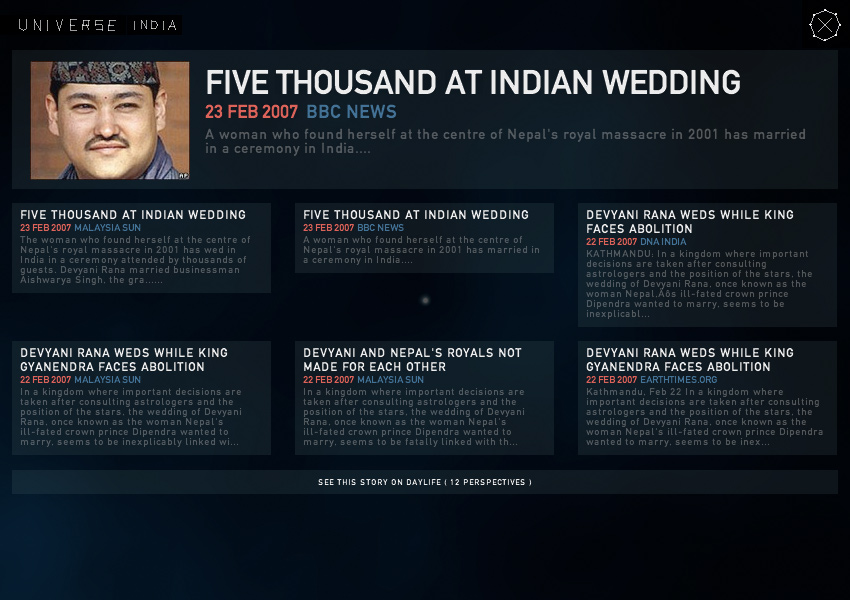
In Stories, the fourth stage, Universe extracts the most important stories (the ones with coverage from the largest number of news sources) from the currently selected data set, and presents them in a grid. The stories are organized by importance from left to right, top to bottom, as we read. Stories that contain photographs include them, and any story can be selected, making it the center of the universe, and causing all related constellations to enter into its circular orbit. If a selected story is clicked a second time, it opens up to fill the entire screen, showing multiple perspectives from different news sources.
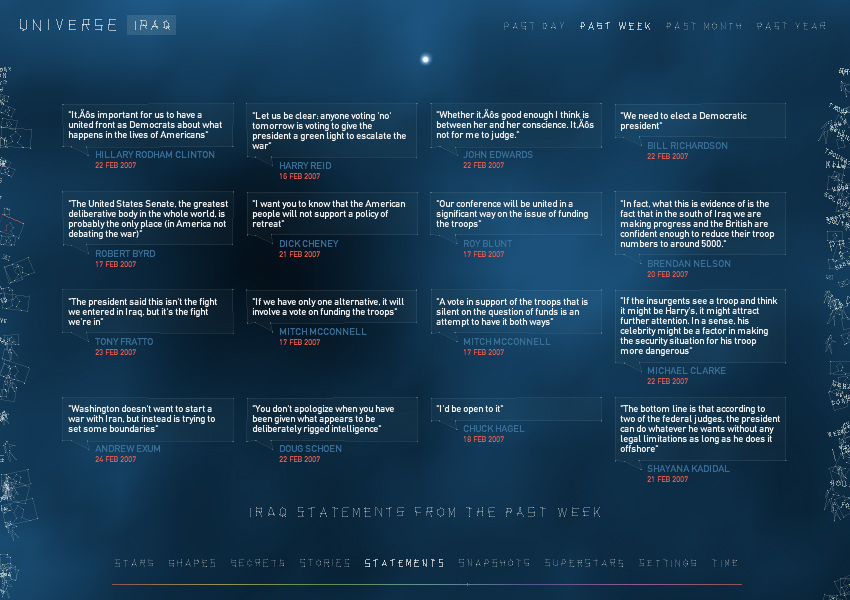
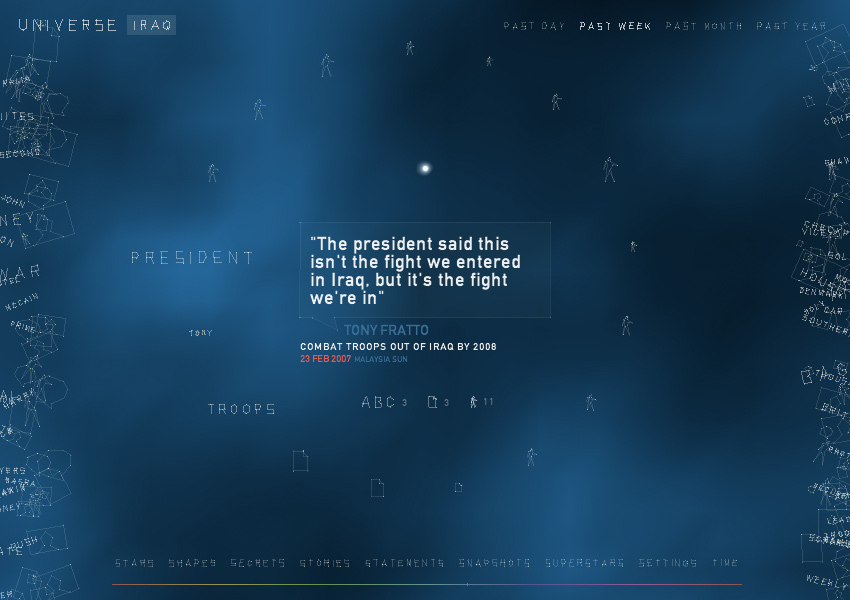
5) Statements
In Statements, the fifth stage, Universe extracts a series of quotes from the most important stories in the current data set, and presents them in a grid. Any statement can be selected, making it the center of the universe, and causing all related constellations to enter into its circular orbit. If a selected statement is clicked a second time, the viewer is taken to the news article in which that quote was originally found.
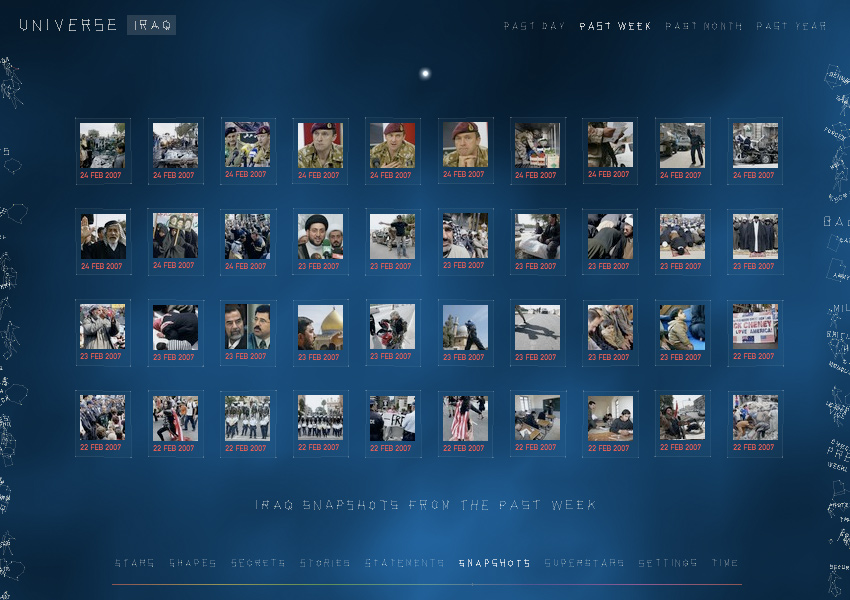
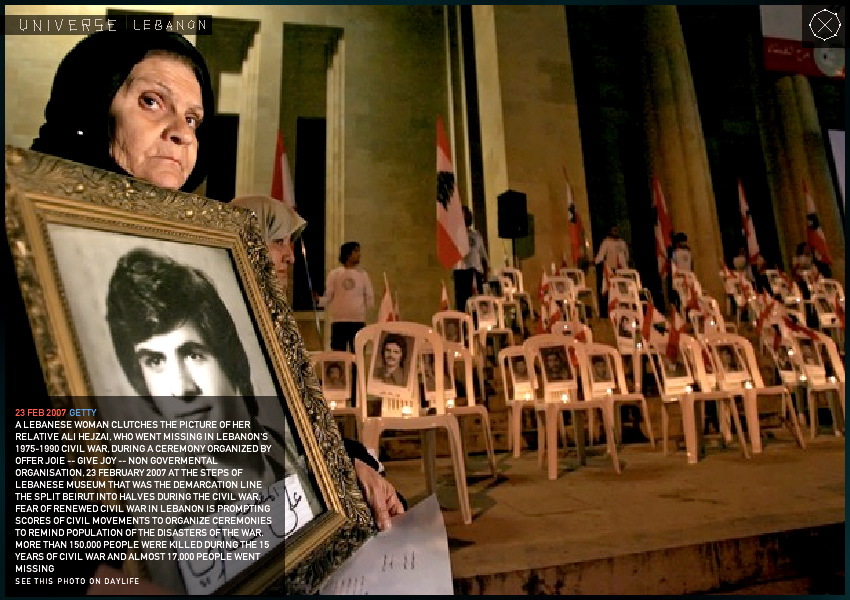
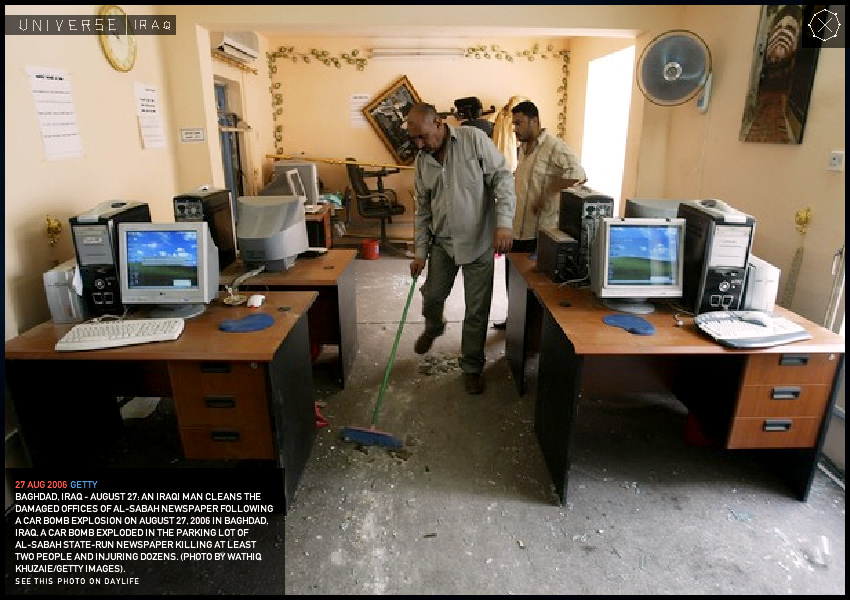
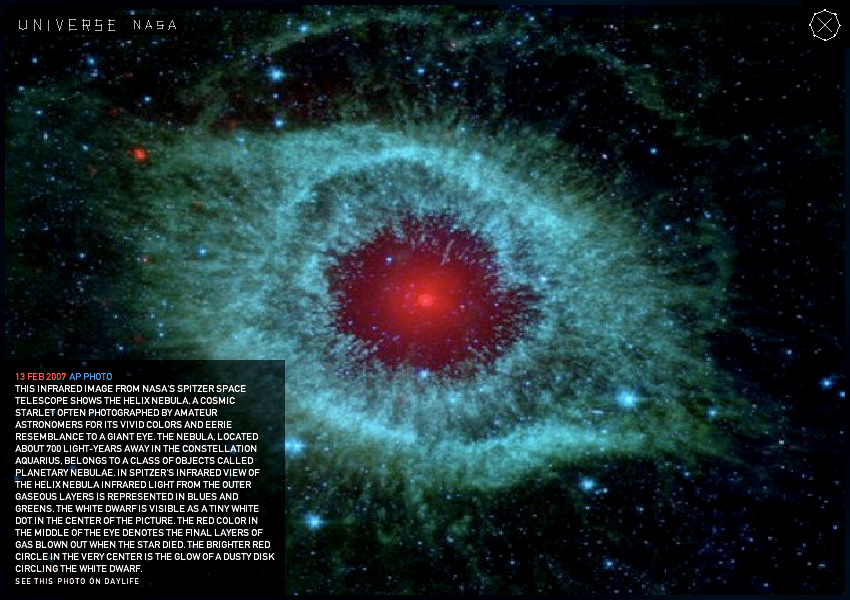
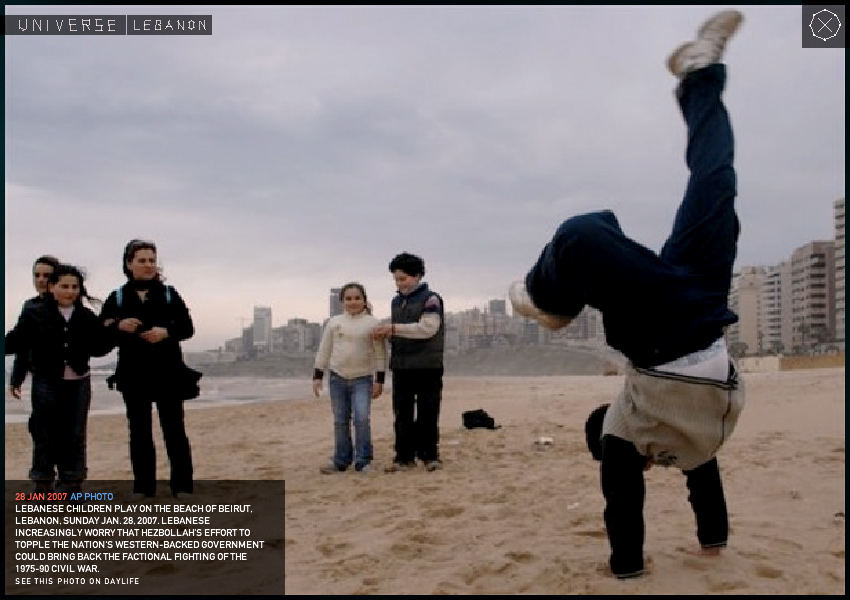
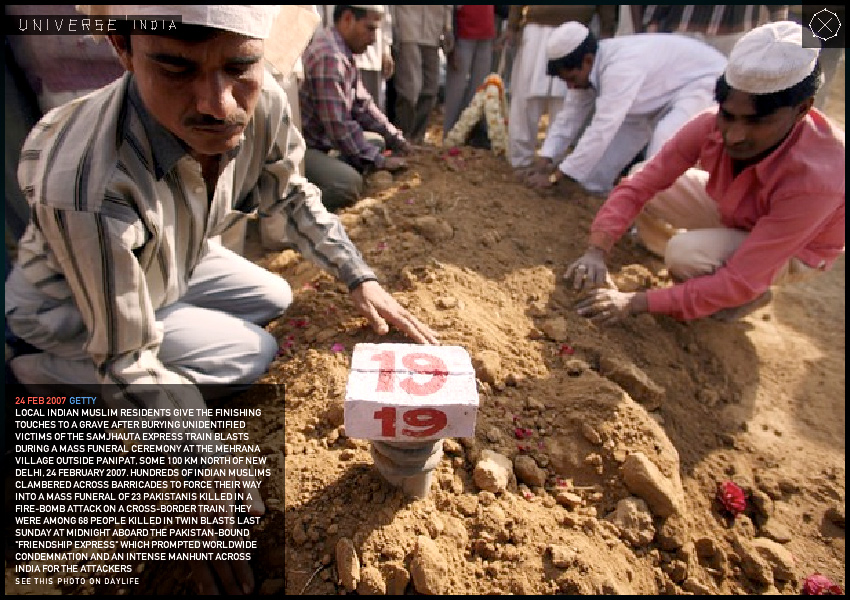
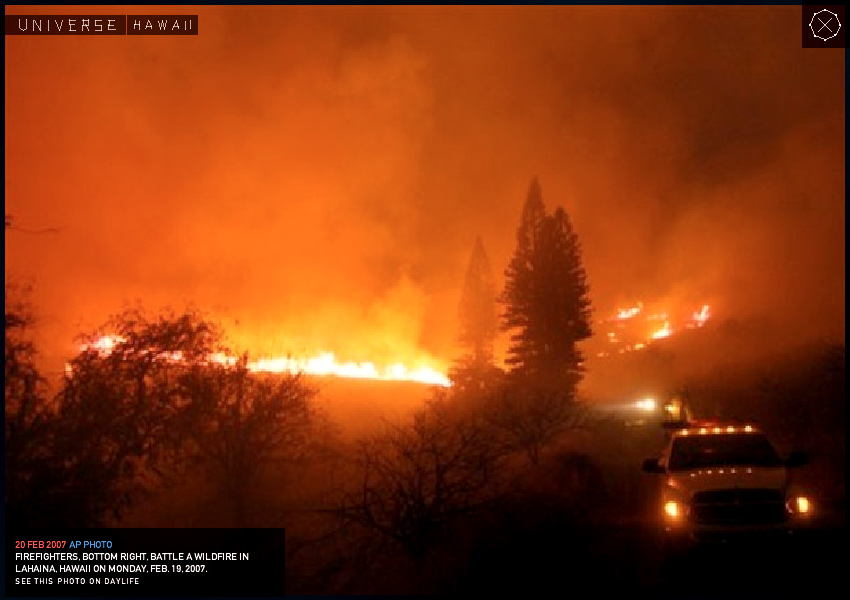
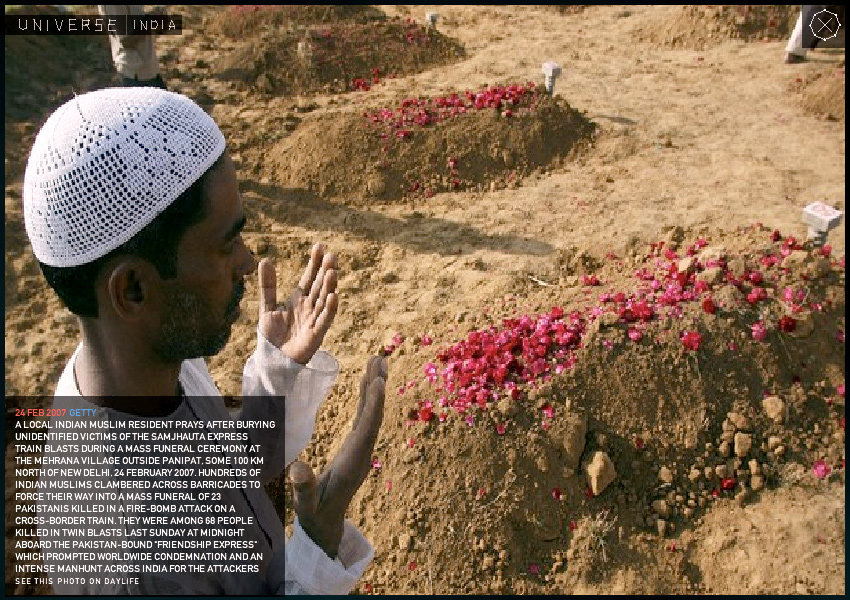
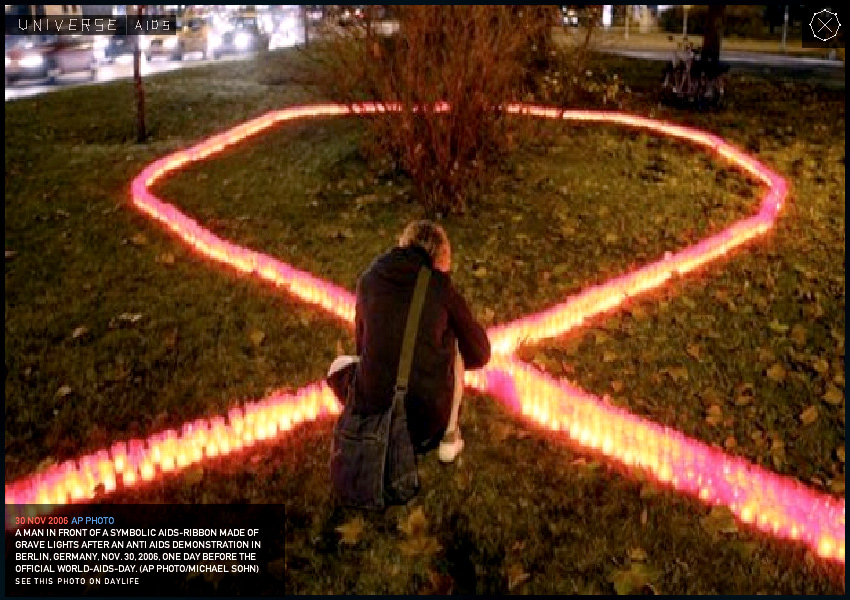
6) Snapshots
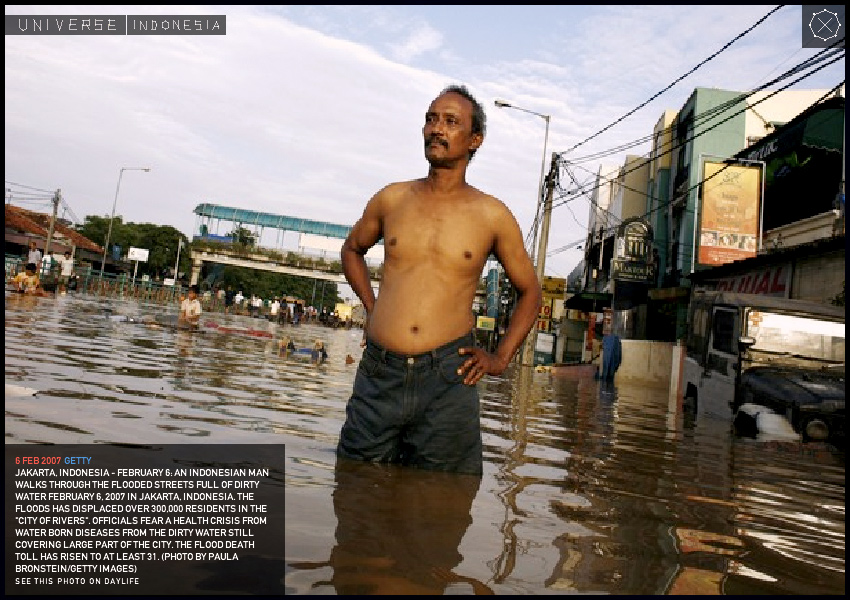
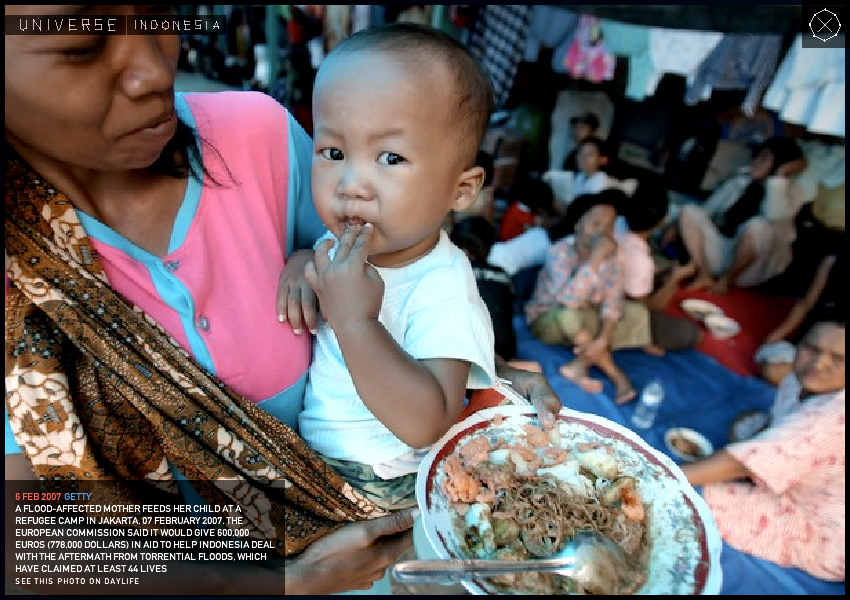
In Snapshots, the sixth stage, Universe extracts the photographs from the current data set, and presents them in a grid. The snapshots are organized by recentness, with the most recent snapshots in the top left corner. Any snapshot can be selected, making it the center of the universe, and causing all related constellations to enter into its circular orbit. If a selected snapshot is clicked a second time, it opens up to fill the entire screen, with a full bleed image and full caption as boxed text.
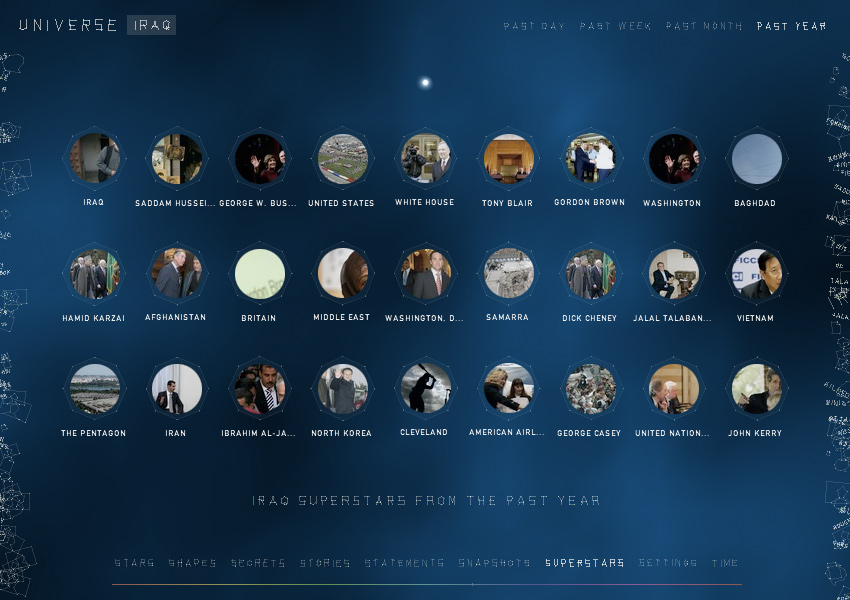
7) Superstars
In Superstars, the seventh stage, Universe extracts the public personas (people, places, companies, teams, governments, and other organizations) from the current data set, and presents them in a grid. The superstars are organized by importance, with the most important superstar in the top left corner. Any superstar can be selected, making it the center of the universe, and causing all related constellations to enter into its circular orbit. If a selected superstar is clicked a second time, the system will find the entire universe of that superstar.
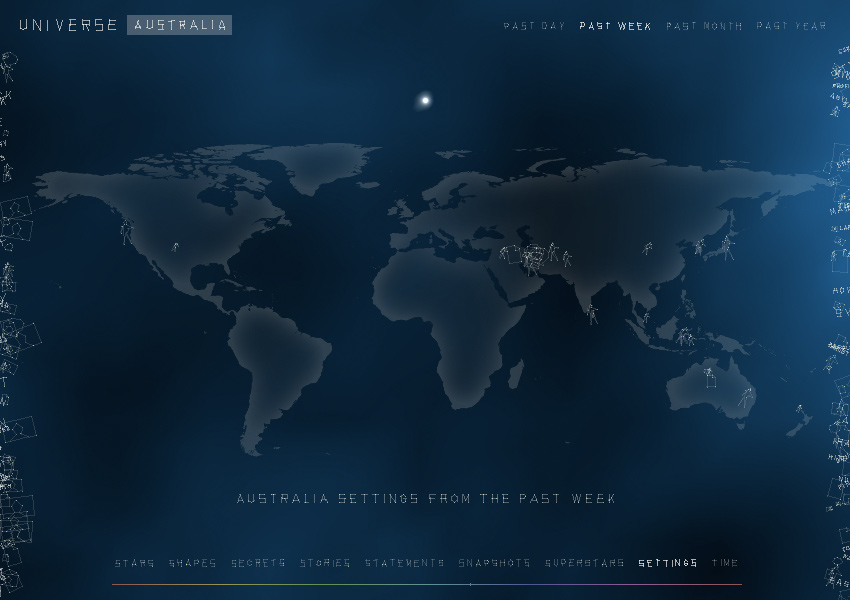
8) Settings
In Settings, the eighth stage, a semi-transparent world map appears, etched onto the sky, and all the constellations in the current universe move to their corresponding locations on the map. This stage shows the geographical distribution of a given data set, highlighting the world regions that are most affected. Any constellation can be rolled over to reveal its location, and a brief summary of its content. Constellations for which a setting cannot be identified move to the sides of the screen.
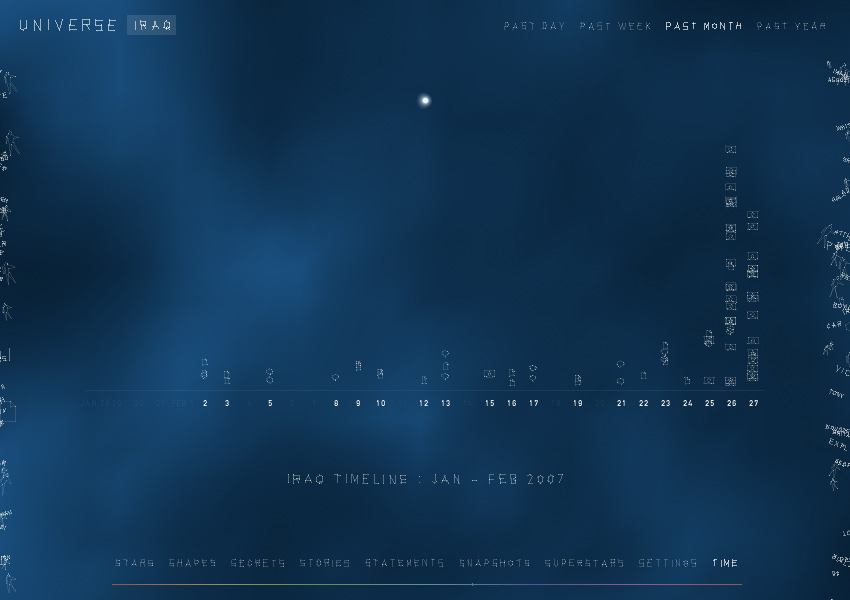
9) Time
In Time, the ninth and final stage, a timeline is formed in the sky, based on the currently selected time range, which then shows the time distribution of the data set across hours, days or months. This stage shows the ways in which a given data set has waxed and waned in importance over time. The label below each timeline bar can be clicked to narrow the universe to that specific time range.